Envirometer concrete
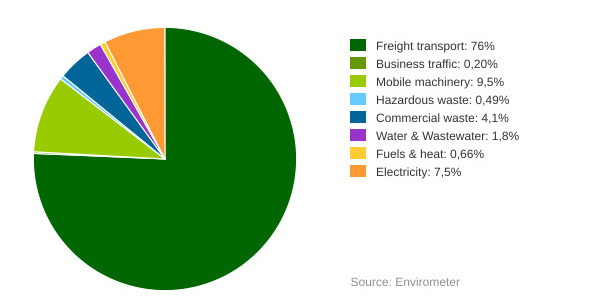
This page shows the environmental impact of the average concrete mortar company, based on an Evirometer graph and key figures. At 77%, goods transport per tonne of concrete mortar has the highest environmental impact by far. Industrial waste, electricity and mobile equipment are other important factors in the environmental balance.
Key figures
The table below shows the key figures for the concrete company benchmark. We have provided the average and the best value wherever possible. All figures are annualized. (n=6)
| Environmental aspect | Key figure | Average | Best | Unit |
| Raw materials | coarse aggregate / m3 concrete mortar | 0.92 | tonnes/m3 | |
| (concrete composition) | fine aggregate / m3 concrete mortar | 0.86 | tonnes/m3 | |
| cement / m3 concrete mortar | 0.31 | tonnes/m3 | ||
| total material / m3 concrete mortar | 2.35 | tonnes/m3 | ||
| Water | water / m3 concrete mortar | 183 | 157 | liter/m3 |
| Waste | construction waste / m3 concrete mortar | 42 | 22 | kg/m3 |
| Transport | diesel / m3 concrete mortar | 2.45 | 1.64 | litres/m3 |
| Energy | Building-specific energy*/m3 concrete mortar | 0.029 | 0.018 | GJ/m3 |
* = Electricity + natural gas + diesel + propane
Source of the average Envirometer
SenterNovem (now: RVO), a local municipality and Stimular carried out an Envirometer benchmark for concrete mortar companies. Six concrete mortar companies submitted their Envirometer with data from 2004. These were used to calculate an average Envirometer and key figures. The product scope of these concrete mortar companies ranged from 13,000 to 74,000 m3 of concrete mortar per year.
“The Envirometer is a valuable tool in reducing environmental impact. That’s why we offer companies in Amsterdam a free introductory subscription.”
Co de Smalen,
Environmental Service, North Sea Canal Area