Current industry average for office organizations available in Envirometer
The Envirometer provides a new current industry average for housing associations and office organizations. This renewed industry average is based on data from 2022. As an office organization, you can use this new benchmark to compare the environmental impact of your organization.

Industry average for offices based on housing associations benchmark
The new industry average for office organizations has been established based on the new benchmark for housing associations. This benchmark was recently updated with data from 2022. A group of housing associations has determined the CO2 footprint and environmental impact of their own offices for the fifth consecutive year. This industry average is applicable to all office locations. The only difference is that for office organizations, goods transportation (such as maintenance services) is excluded from consideration.
Reduced environmental impact of offices through real estate sustainability and remote work
The difference in environmental impact from 2021 is limited. This is good news as it indicates that the significant decrease from the period of the COVID-19 pandemic has been maintained. The environmental impact of office organizations has significantly decreased since 2018. This reduction is the result of both real estate sustainability efforts and increased remote work.
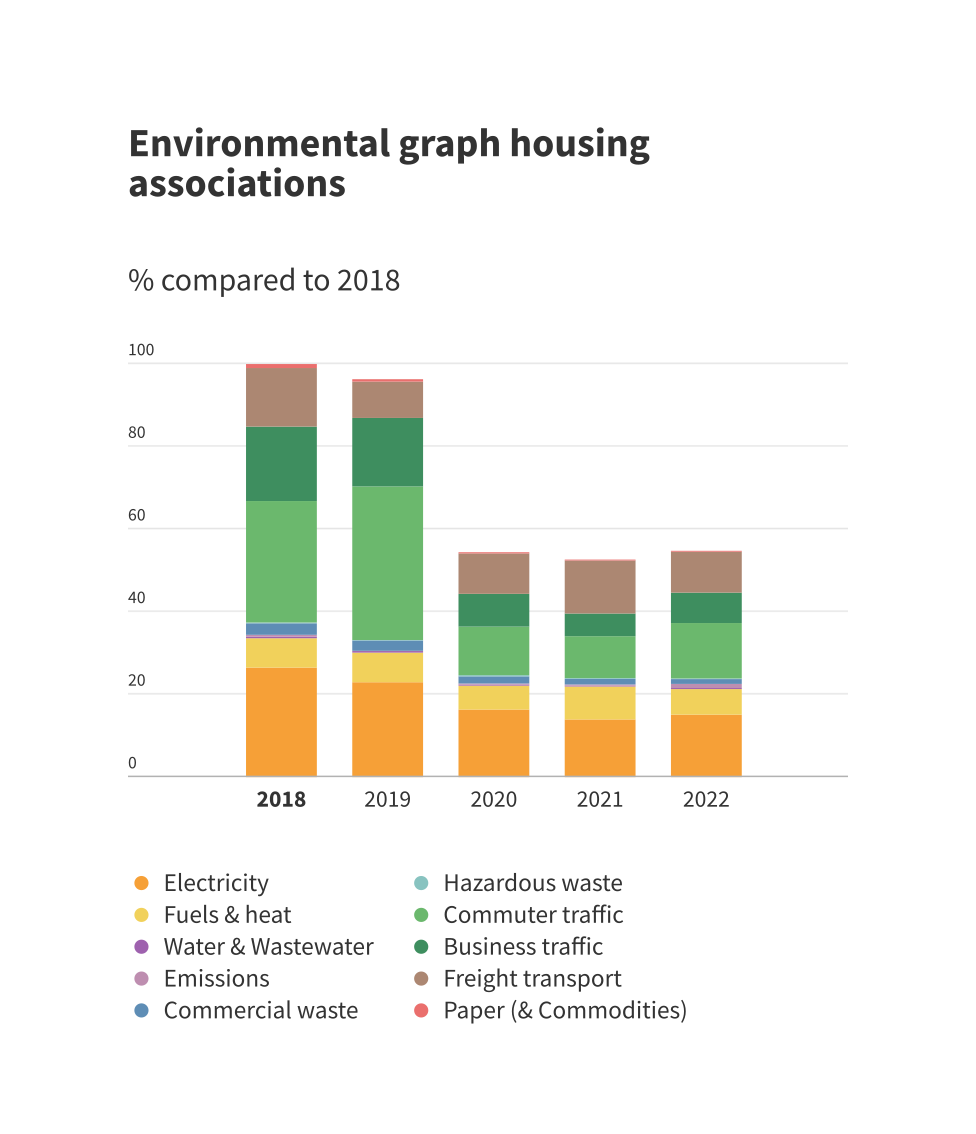
The 2022 figures show that employees are returning to the office more. Business and commuting traffic have increased but remain small compared to 2018. This is evident from the light-green bars in the environmental graph of housing associations below.
Average energy consumption office buildings
Returning to the office also means increased energy and water consumption in the buildings, both of which increased by 10%. However, this increase is smaller than that of the number of miles driven. This is partly because having 30% more people in the office doesn’t necessarily require 30% more lighting. As for water, while sanitary use will correspond to office occupancy, water usage for cleaning will hardly increase. Additionally, we observe that the environmental impact of electricity has decreased, due to both an increase in solar panels and more procurement of green energy.
Continued impact of the COVID-19 pandemic on average CO2 footprint of offices
For the fifth consecutive year, the industry average for housing associations has been calculated. This allows us to clearly see the (ongoing) effect of the COVID-19 pandemic on the footprint:
- 2020: The environmental impact decreased by over 40% compared to 2018/2019. The most significant effect is visible in business and commuting traffic.
- 2021: Even more people working from home, but due to a colder year and more maintenance, the environmental impact remained nearly the same.
- 2022: In this year’s results we can see that employees are returning to the office. However, due to a relatively warmer year and fewer maintenance activities, the environmental impact remains at least 40% lower than before the pandemic.
The challenge now is to maintain and even further reduce the lower environmental impact and CO2 emissions. Achieving zero impact still requires substantial effort!
How to use the industry average for office organizations and housing associations in the Envirometer
The newly calculated industry average has been made available in the Envirometer for all housing associations and office organizations. For housing associations, goods transportation is considered in calculating the CO2 footprint, whereas for offices it’s excluded.
Comparison with the industry average in the Envirometer can be done using the graphs and key metrics, such as energy consumption per square meter of floor space or fuel consumption for business travel per rentable unit. This will allow you to see how your organization performs compared to the average and analyze where improvements can be made.
The environmental graphs and key metrics of the new industry averages can also be found on this website:
Get started with the Envirometer
Want to get started immediately? No problem! Take out a subscription today and get started by filling in your details.

Milieubarometer implements new environmental prices of CE Delft
This year, the new environmental prices that CE Delft published in 2023 have been implemented in the Envirometer. This way we ensure that the tool remains up to date with developments in science and politics. But why is this important? And what exactly are the environmental prices?

Yearly update CO2-factors february 2024
The annual update of the CO2 emission factors took place on January 22, 2024 www.co2emissionsfactors.nl. All changes were implemented in the Envirometer on February 5. It is useful for Milieubarometer users to know the most important changes.

Free sumbarometer with a subscription for two or more barometers
Organizations with multiple barometers now also have a standard free sumbarometer. This allows you to automatically add up to a total footprint.